- Understanding Quality
- Quantization Tables
- Details
- Mapping Values
- Estimating Quality
Tutorial: Estimate JPEG Quality
JPEG images use a variable quality level to control the amount of compression. However, the JPEG quality is typically not stored in the metadata. There are ways to estimate the JPEG quality level last used to save the image.Understanding Quality
JPEG images use a lossy compression algorithm. This algorithm trades quality for compression. A low-quality image results in a smaller JPEG file; a high-quality image generates a relatively large file. This is different from lossless image formats, such as PNG, BMP, and PPM, where the quality never degrades.The amount of JPEG compression is typically measured as a percentage of the quality level. An image at 100% quality has (almost) no loss, and 1% quality is a very low quality image. In general, quality levels of 90% or higher are considered "high quality", 80%-90% is "medium quality", and 70%-80% is low quality. Anything below 70% is typically a very low quality image.
For example, the following pictures were saved at different quality levels. The first picture is a PNG (not a JPEG) and represents the baseline lossless (100% quality) image. The next four images show the baseline picture saved at 90%, 80%, 70%, and 25% quality.
| Image | Difference from baseline | Description |
|---|---|---|
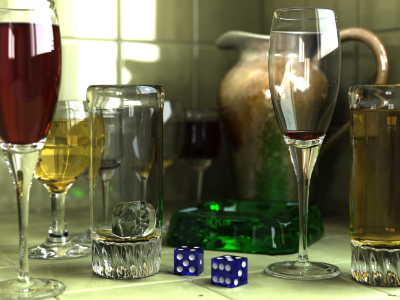 | Baseline lossless (100% quality) image. (Source: "Glasses, pitcher, ashtray and dice (POV-Ray)", Gilles Tran, 2006). | |
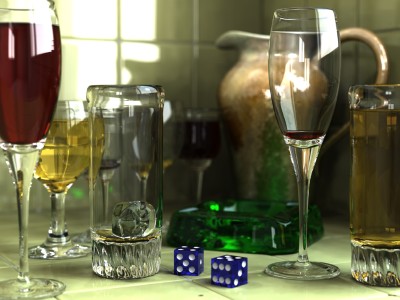 | 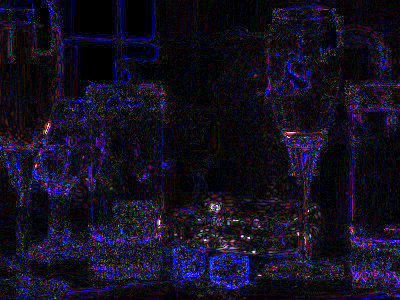 | Baseline image saved as a 90% quality JPEG. Visibly, there is very little difference. Only the edges are a little less crisp. |
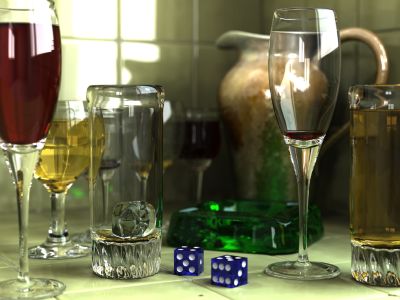 | 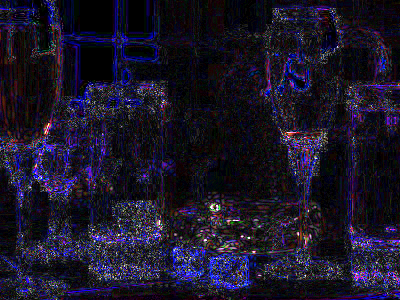 | Baseline image saved as a 80% quality JPEG. Fine details, like the dice and glass bases, are a little blurry. |
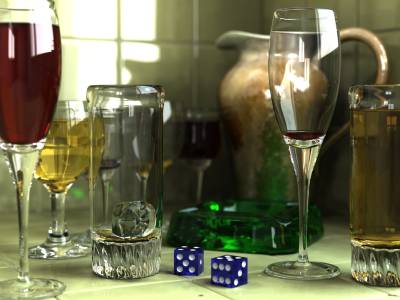 | 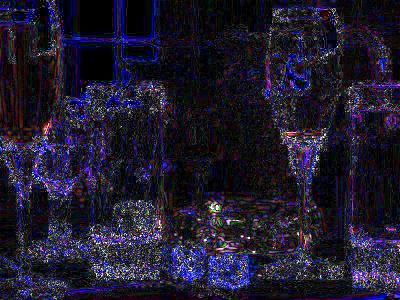 | Baseline image saved as a 70% quality JPEG. Edges are no longer crisp and compression artifacts are visible. E.g., the base of the pitcher's curved handle (behind the nearly empty glass) is very blurry and distorted. |
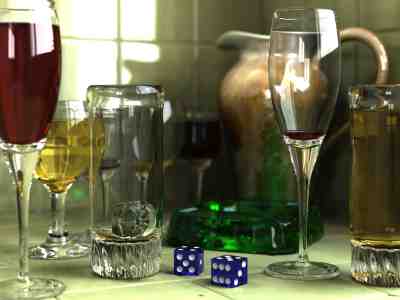 | 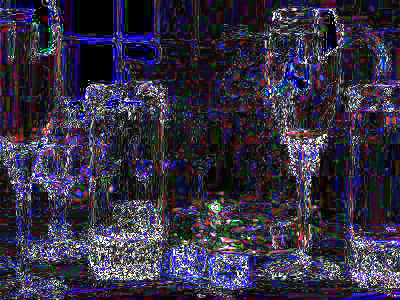 | Baseline image saved as a 25% quality JPEG. Significant JPEG artifacts are visible around all edges. Most appear as ripples and echo lines. |
Quality Impact
The selected quality level is used to determine the quantization tables used with the JPEG image. The quantization tables control the amount of loss during the compression and the size of the compressed file. This means that the quality level directly impacts the visual quality of the image and the file size.From a forensic viewpoint, there is another impact from quality. Low quality images can reduce the ability to detect modifications with some analysis algorithms. For example, Error Level Analysis (ELA) works by resaving an image at a known quality level, such as 75%, and then identifies the amount of error introduced during the resave. If the image was last saved at 75%, then ELA at 75% is unlikely to highlight any change. This can be problematic when you consider that picture hosting sites like Facebook may resave JPEG images at 75% quality or lower; with ELA, a picture from Facebook is unlikely to have any identifiable modifications. Similarly, analysis algorithms based on signal noise detection and focal quality are unlikely to be effective on low quality images. In contrast, analysis based on JPEG artifact detection may still be applicable, even on very low quality images.
Quality and Quantization Tables
JPEG's lossy compression is due to a matrix of values called the quantization tables. These tables restrict the range of values (quantizes values) that are compressed by the JPEG algorithm. The tables are stored in the JPEG and are directly responsible for the picture's quality.Color JPEG pictures typically use two quantization tables to encode the image. One table is for the luminance (grayscale intensity) and the other is applied to the chrominance (coloring). However, there are some variations. For example, a grayscale JPEG may only encode the luminance, and a few JPEGs include two chrominance quantization tables for chrominance-red and chrominance-blue.
Standard Quantization Tables
The JPEG Standard (CCITT/ITU T.81 Annex K) includes a section titled "Examples and guidelines" that provides two fixed quantization tables as an example for scaling the image's quality:
|
| |||||||||||||||||||||||||||||||||||||||||||||||||||||||||||||||||||||||||||||||||||||||||||||||||||||||||||||||||||||||||||||||||||||||||||||||||||
These tables are referred to as "50%". The JPEG Standard also defines a scaling algorithm that can be used to alter these values to approximate the quality range from 1% to 100%. (This algorithm makes it easy for an application to provide 100 quality levels without hard-coding 100 pairs of quantization tables.) Many applications follow the JPEG Standard and use the sample quantization tables and scaling algorithm to quickly apply a selected quality level.
Non-Standard Quantization Tables
The JPEG Standard's quantization tables are explicitly provided as an example; compliance is neither required nor essential. They are called the "Standard Quantization Tables" because they are described as examples in the JPEG Standard document, and not because of some standard requirement to use them.Applications do not need to follow the JPEG Standard when determining quantization tables. Many devices and applications use their own, custom quantization tables. These are referred to as "non-standard" since they do not follow the examples in the JPEG Standard. Adobe, for example, defaults to using non-standard quantization tables and scaling algorithms. Similarly, if your digital camera has quality settings for "High", "Medium", and "Low", then it is actually referring to three hard-coded sets of quantization tables that are often non-standard.
Multiple Quantization Tables
Most JPEG images use two quantization tables: luminance (grayscale intensity) and chrominance (color). However, this is not essential.- Grayscale images only use one table that defines luminance. Any chrominance tables are optional and unused.
- Color JPEG images do not need a chrominance table. If the chrominance table is not defined, then the luminance table is used for both chrominance and luminance.
- Some JPEG images include 3 tables: luminance, chrominance-red, and chrominance-blue. (More often than not, the two chrominance tables have the same values.)
Chrominance Subsampling
Although each quantization table contains 8x8 values, the image may encode chrominance using an 8x8, 8x16, 16x8, or 16x16 grid. When decoding an image:- The JPEG library extracts the 8x8 chrominance values.
- It applies the appropriate quantization table to de-quantize the values.
- It scales the resulting pixel values to the correct grid dimensions.
Quantiation Table Precision
Most of the time, the quantization tables use one byte per value, or 8-bit precision. Each quantization table value is in the range 1 to 255, with higher numbers denoting lower qualities. This means that the stored values can be scaled by any of 255 different settings.A few JPEG images may be encoded using a higher-precision. Rather than using 8-bit precision, the encoder may use 16-bit precision. This results in quantization table values within the range 1 to 65535. Again, higher values denote lower qualities; the 16-bit value 32768 is similar to the 8-bit value 128; both denote half of their respective ranges.
Considering that the JPEG algorithm encodes an 8x8 grid for the pixel values, higher precision is unlikely to improve the image quality by any noticeable amount.
JPEG %
The JPEG % algorithm evaluates the values in the quantiation tables. If the tables align with the JPEG Standard, then it identifies the required scaling factor. For non-standard tables, the algorithm estimates the percentage needed to achieve the same quality using the JPEG Standard values.The results from JPEG % include:
- The percentage needed to achieve the same quality using the JPEG Standard values.
- Whether the percent value matches the JPEG Standard or is an estimate based on non-standard quantization tables.
- The raw quantization tables extracted from the JPEG.
- If the picture is not a JPEG, then JPEG % identifies the file as lossless and equivalent to 100% quality.
Technical Details
The JPEG compression algorithm divides the image into a grid with 8x8 pixel cells. If the picture is 800x600 pixels, then that means the picture contains a 100x75 grid of 8x8 pixel cells. (800÷8=100 and 600÷8=75.) Each 8x8 cell is encoded separately.The descrete cosine transform (DCT) converts a series of descrete values (pixel colors) into a set of 8x8 of frequencies. The top -eft corner are the lowest frequencies (solid colors, or few transitions). The bottom-right corner has the highest frequencies (the most complexity). To understand this table, you need a set of frequencies scalars. (JPEG uses frequency scalars that range from -1024 to +1024.) For example:
|
 |
This says to take the first basis frequency (solid white) and scale it by -49 (making it a little darker). Add to it the second basis frequency (white/black) multiplied by -145 (making it more black/white than white/black), and so on. The total sum of scaled basis functions yields the actual 8x8 pixel pattern.
These 8x8 basis frequencies are the same for every JPEG grid. The only difference between the grids are the scalars. The JPEG encoding algorithm only stores these scalar values.
The human eye is more sensitive to low frequencies than high frequencies. This means that the JPEG encoding algorithm can drop off some of the higher frequencies without having too much impact on the decoded image. (Most people won't notice.) And since removing higher frequencies means less data, the JPEG algorithm can compress the data stream better than if it retained all of the original data. The downside is that it loses high frequency information, resulting is a "lossy" compression.
Quantization Tables
Quantifying means converting data to a descrete range. In this case, it means converting the entire range per frequency (-1024 to +1024) into a subset of that range. For example, the quantified value of "2" means the range will ignore odd numbers; it only needs to encode half of the values. A quantization value of 8 means it stores an eighth of the total values. Think of quantization like stair steps; the bigger the value, the steeper the step.JPEG uses quantization tables to define the scaled range per frequency. For example:
| Luminance | |||||||
|---|---|---|---|---|---|---|---|
| 16 | 11 | 10 | 16 | 124 | 140 | 151 | 161 |
| 12 | 12 | 14 | 19 | 126 | 158 | 160 | 155 |
| 14 | 13 | 16 | 24 | 140 | 157 | 169 | 156 |
| 14 | 17 | 22 | 29 | 151 | 187 | 180 | 162 |
| 18 | 22 | 37 | 56 | 168 | 109 | 103 | 177 |
| 24 | 35 | 55 | 64 | 181 | 104 | 113 | 192 |
| 49 | 64 | 78 | 87 | 103 | 121 | 120 | 101 |
| 72 | 92 | 95 | 98 | 112 | 100 | 103 | 199 |
This quantization table says that the scalars for the lowest frequency (solid white) should be divided by 16 before being stored. Rather than storing numbers in the range [-1024,+1024], it uses the range [-64,+64]. A smaller range requires fewer bits in the encoded data stream. The scalar for the next lowest frequency is divided by 11. And the highest frequency (which has the lowest impact on the human eye), should be divided by 199 for the range [-5,+5].
During decoding, the quantization table is re-applied. For example, if the original scalar value was -49, then -49÷16 = -3.0625. JPEG uses integer math and ignores fractions, so this is -3 and it is encoded into the JPEG data stream. When decoding, JPEG multiplies -3×16 = -48, which is close enough to the original value. These little changes may not be enough for the human eye to notice, but this also leads to "lossy" compression. This multiplication step is also why the quantization tables used to encode the image must be included with the JPEG file in order to decode the image. Decoding with the wrong quantization tables will result in a blurry picture.
Smaller quantization table values means less data loss and a higher quality image. Bigger values result in a much lower quality image. With quantization tables, you will usually see the lower frequencies (top-left corner) using smaller numbers than the higher frequencies (bottom-right corner).
The values used for the quantization tables are specified by the encoder. When you save a JPEG at 95% quality, it uses a set of tables with lots of low values. Saving a JPEG at 75% will use tables with larger values. And an extremely low quality JPEG (e.g., using 10% quality) will use very large values. The JPEG % algorithm evaluates the quantization tables in order to approximate the last-saved quality level.
Mapping Values
Although the quantization table format and usage is well defined, there is no widely accepted method for translating table values into a descriptive JPEG quality. The JPEG Standard (CCITT/ITU T.81 Annex K and RFC 2435 section 4.2) defines an approach that uses a scalar to adjust a set of well-defined quantization tables. However, the JPEG Standard uses two separate algorithms; one computation is used when scaling between 50% and 100% quality, and a different algorithm scales between 1% and 50% quality. The "% quality" is not really a percentage of any metric; it is just a nomenclature.Adobe
The JPEG Standard defines one approach for determining quantization tables, but it is not the only approach. For example, Adobe Photoshop offers multiple scaling methods:- Save As. One method used by Photoshop is seen when using "Save As" and allows the user to select one of 12 quality levels with names like "Maximum", "High", and "Low".
- Save for Web. Another method appears when using "Save for Web" and permits the user to select a quality value from 0 to 100. However, saving an image with Photoshop at "75" is not the same as saving a JPEG using the JPEG Standard algorithm at 75% quality.
- Advanced. Photoshop includes an advanced option to save using the JPEG Standard algorithm rather than its own quantization tables. However, this option is buried in the menus and the location varies by software version.
| JPEG Standard | Adobe Save-for-Web | Adobe Save-As |
|---|---|---|
| 100% | ||
| 99% | 99, 100 | 12 |
| 98% | 94, 95, 96, 97, 98 | |
| 97% | 90, 91, 92, 93 | 11 |
| 96% | 87, 88, 89 | |
| 95% | 84, 85, 86 | |
| 94% | 81, 82, 83 | |
| 93% | 78, 79, 80 | 10, Maximum |
| 92% | 75, 76, 77 | |
| 91% | 73, 73 | |
| 90% | 70, 71, 72 | 9 |
| 89% | 68, 69 | |
| 88% | 66, 67 | |
| 87% | 65 | |
| 86% | 63, 64 | 8, High |
| 85% | 61, 62 | |
| 84% | 60 | |
| 83% | 57, 58, 59 | |
| 82% | 54, 55, 56 | 6 |
| 81% | 51, 52, 53 | |
| 80% | 49, 50 | |
| 79% | 47, 48 | 7 |
| 78% | ||
| 77% | 46 | |
| 76% | 45 | 5, Medium |
| 75% | 43, 44 | |
| 74% | ||
| 73% | 42 | |
| 72% | 40, 41 | |
| 71% | 39 | |
| 70% | ||
| 69% | 37, 38 | 4 |
| 68% | 36 | |
| 67% | 35 | |
| 66% | 34 | |
| 65% | 32, 33 | |
| 64% | ||
| 63% | 30, 31 | |
| 62% | 29 | 3, Low |
| 61% | 28 | |
| 60% | 27 | |
| 59% | 26 | |
| 58% | 25 | |
| 57% | 23, 24 | |
| 56% | ||
| 55% | 21, 22 | |
| 54% | 20 | |
| 53% | ||
| 52% | ||
| 51% | ||
| 50% | ||
| 49% | ||
| 48% | ||
| 47% | 2 | |
| 46% | ||
| 45% | ||
| 44% | ||
| 43% | ||
| 42% | ||
| 41% | ||
| 40% | ||
| 39% | ||
| 38% | 16, 17, 18, 19 | |
| 37% | 14, 15 | |
| 36% | 11, 12, 13 | |
| 35% | 10 | |
| 34% | 9 | 1 |
| 33% | ||
| 32% | 8 | |
| 31% | 7 | |
| 30% | 0 | |
| 29% | 6 | |
| 28% | 5 | |
| 27% | 3 | |
| 26% | 1, 2 | |
| 25% | 0 | |
| 24% | ||
| 23% | ||
| 22% | ||
| 21% | ||
| 20% | ||
| 19% | ||
| 18% | ||
| 17% | ||
| 16% | ||
| 15% | ||
| 14% | ||
| 13% | ||
| 12% | ||
| 11% | ||
| 10% | ||
| 9% | ||
| 8% | ||
| 7% | ||
| 6% | ||
| 5% | ||
| 4% | ||
| 3% | ||
| 2% | ||
| 1% |
For notations, a quality level with a percent sign (e.g., 86%) refers to the JPEG Standard. A value without a percent sign (e.g., 86) refers to non-standard quantization tables. Non-standard quantization tables may also be associated with a text name, such as "High" or "Medium".
Cameras
Most digital cameras have different quality settings. These usually have names like "High" and "Low" but do not identify a numerical quality value. Each of these built-in camera quality levels identifies hard-coded quantization tables that are defined in the camera's firmware.It is common for different cameras to use different hard-coded quantization tables with the same textual names. The "High" setting on a Canon camera is unlikely the same as "High" on an Olympus, Nikon, or other type of camera. The hard-coded quantization tables are often distinct to a specific make and model. Different cameras in the same product line frequently use different different quantization tables.
Estimating Quality
As important as the JPEG quality is to image forensics, the save-as quality value is not typically stored in the JPEG metadata. Instead, it needs to be either identified or estimated. There are a number of approaches for identifying the quality of a JPEG.| Method | Description |
|---|---|
| Ballistics | The quantization table selection directly impacts the JPEG quality. If the quantization tables can be identified as coming from a known device or application, then the quality level is known. A brute-force approach collects every set of quantization tables from every known camera and application, and then performs a lookup to match the set of quantization tables from a new JPEG image to a known quality level. |
| Metadata | In rare cases, the application creating the JPEG may store the quality level as a metadata field. With some Adobe products, there may be an Adobe metadata field that identifies either the quality level or range used for the image. However, the presence and values in these fields vary by Adobe product, version, and even saving options. Other JPEG libraries, such as gd-jpeg, may store the quality level in a plain-text comment, such as "CREATOR: gd-jpeg v1.0 (using IJG JPEG v62), quality = 95." With some digital cameras, the quality may be embedded in camera-specific "Maker Notes" metadata.
Metadata is an unreliable source for identifying the quality level. For example, ImageMagick will retain comments and metadata fields generated by other applications. As a result, it is possible to have a single JPEG image containing a comment from gd-jpeg that identifies "quality = 95", and an Adobe record indicating "Level 10", and quantization tables that match a ballistics entry of 75% quality. In general, metadata descriptions of the JPEG quality level are rarely available, inconsistent between applications, and unreliable when present. However, any identified inconsistencies can be used to identify likely resaves. For example, if the text comment says it was last saved at "quality = 80%" but the quantization tables match 95%, then the picture was likely first saved at 80% and then resaved at 95%. |
| Approximate Ratios | The ratio of values between the JPEG quantization tables can be used to estimate the overall quality level. One method of estimating the JPEG quality is found in Neal Krawetz's jpegquality.c. This system is accurate for pictures saved at 50% quality or higher. But since the JPEG Standard changes algorithms at quality values below 50%, this method can become unreliable with very low quality images. |
| Approximate Quantization Tables | This approach estimates the scalar factor needed to make the JPEG Standard quantization tables appear most similar to the quantization tables found in the JPEG image. If the image was created using the JPEG Standard's scaling method, then this will produce a very accurate result. For Adobe "Save As", this approach will estimate numerical qualities. For example, Save As "Maximum (Level 10)" is comparable to the JPEG Standard at 93% quality, "High (8)" is 86%, and "Medium (5)" is 76%. With digital cameras, "High" is typically at or above 90% quality, but some cameras even have a "Low" quality that is above 90%. |
Estimation Method
FotoForensics uses the Approximate Quantization Tables approach and ignores metadata when estimating the last saved quality. The result identifies the JPEG quality relative to the JPEG Standard. FotoForensics also indicates whether the quantization tables match the JPEG Standard, or whether they are an approximation from a non-standard set of quantization tables.Because the metadata is not used to estimate the last-saved quality level, it can be compared against any quality values stored in the metadata. If the derived quality matches the metadata, then it could be that the metadata reflects the last save. However, a mismatch indicates a resave and the metadata likely reflects a prior save.
In general, higher quality values result in better analysis results since high quality pictures retain more detail.
Caveats
As previously mentioned, low quality images can limit the effectiveness of some forensic analysis methods. In addition, the resulting percentage is based on the scale used by the JPEG Standard, so the value is unlikely to match the value used when saving with an Adobe product.Each time a JPEG is saved (not copied, but actually opened in a graphics editor and reencoded, or resaved), the quality of the image degrades. If a JPEG is saved at 90%, and then the 90% image is loaded and resaved at 75%, then the quality of the visible picture becomes equivalent to an image saved at 67.5% (75% of 90%). Even though the quality of the picture is significantly degraded, the approximated quality level will only report the quality from the last resave. It will report the 75% value and not the combined 67.5% visible quality level. To reiterate, this forensic method only reports the quality used for the last save, and not the visible quality level.
Copyright 2012-2026 Hacker Factor, All Rights Reserved. • System Status • Blog • FAQ • Contact
